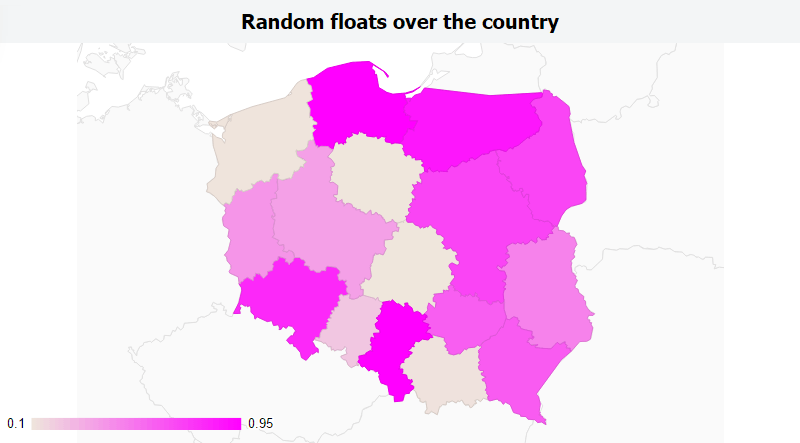
Recently I found out about great charting library and I’m astonished to see how easy it was to integrate it into a project. Google Charts is a free, pure-JS library. You embed the script, write about ten lines of code and it works.
Hello charts!
Include link to library hosted by Google:
<script type="text/javascript" src="https://www.gstatic.com/charts/loader.js"></script>
We just add the data and it works:
The code for you:
Geocharts for free
Another cool feature of Google Geocharts is possibility to render maps of the world with different granularity (specified by resolution option). In this example I added click handling (yes, it supports input!).
Click the Result tab to see it in action:
Easy, huh?
I still can’t believe that there is so painless library with a ready set of charts to use. Go to the Google Charts official website and search for your own!


did you ever try amcharts? I’m thinking of differences and usability
Not before. The demos look really cool (I love the plane flying along the line :)), but they embed a link unless you buy a license.